
🚀 SAGA/USD Technical Analysis: Signs of Accumulation, Bullish Momentum Ahead?
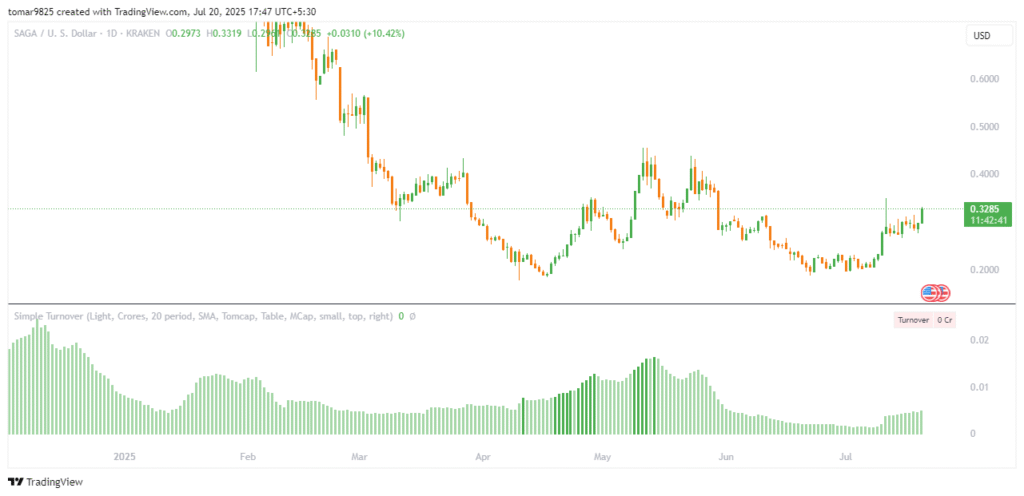
Pair: SAGA / USD
Exchange: Kraken
Current Price: $0.3285
Date: July 20, 2025
Timeframe: Daily (1D)
🔍 Overview
SAGA/USD is showing early signs of a potential trend reversal. After months of sideways movement and low momentum, the price has started to climb gradually. Today’s 10.42% gain is particularly noteworthy, as it comes with increasing turnover — a possible hint of accumulation.
📈 Price Action Summary
- Strong Downtrend (Q1 2025)
Initially, SAGA faced a prolonged downtrend, dropping from above $0.60 to below $0.20. During this phase, sellers clearly dominated. - Range-Bound Phase (April to July)
After bottoming out in late Q2, the price entered a consolidation phase. Despite multiple attempts, it struggled to move above the $0.35 zone. - Bullish Break Attempt (July)
Recently, price action has turned more constructive. Not only has the price moved above key short-term resistance, but volume bars are also rising. This typically indicates growing buyer interest. - Volume Confirmation
Importantly, turnover is picking up for the first time in weeks. While still not high, this shift in volume may support a stronger breakout in the sessions ahead.
🧭 Key Technical Levels
- Immediate Resistance: $0.35
- Next Resistance: $0.42
- Immediate Support: $0.28
- Major Support Zone: $0.20
If the price can close above $0.35 with strong volume, it could confirm the start of a bullish trend. Conversely, a fall below $0.28 might invalidate the setup.
🔄 Trend Outlook
Currently, the market sentiment appears cautiously bullish. While a confirmed breakout hasn’t occurred yet, the structure is improving:
- Price is making higher lows
- Turnover is expanding
- Momentum is building slowly
Therefore, traders should watch closely for a breakout above $0.35 to signal stronger upside potential.
✅ Conclusion
SAGA/USD has endured a long correction, but recent price behavior suggests a shift in momentum. If bulls can sustain this move, we could see a test of the $0.42 level in the near term. However, caution is warranted until a breakout is confirmed.
📌 View: Bullish bias above $0.35
🔺 Upside Targets: $0.42 and $0.50
🔻 Support to Watch: $0.28 and $0.20
⚠️ Disclaimer: This analysis is for educational purposes only and does not constitute financial advice. Always do your own research or consult a licensed advisor before investing.