Daily GBPUSD Analysis on the H4 Timeframe
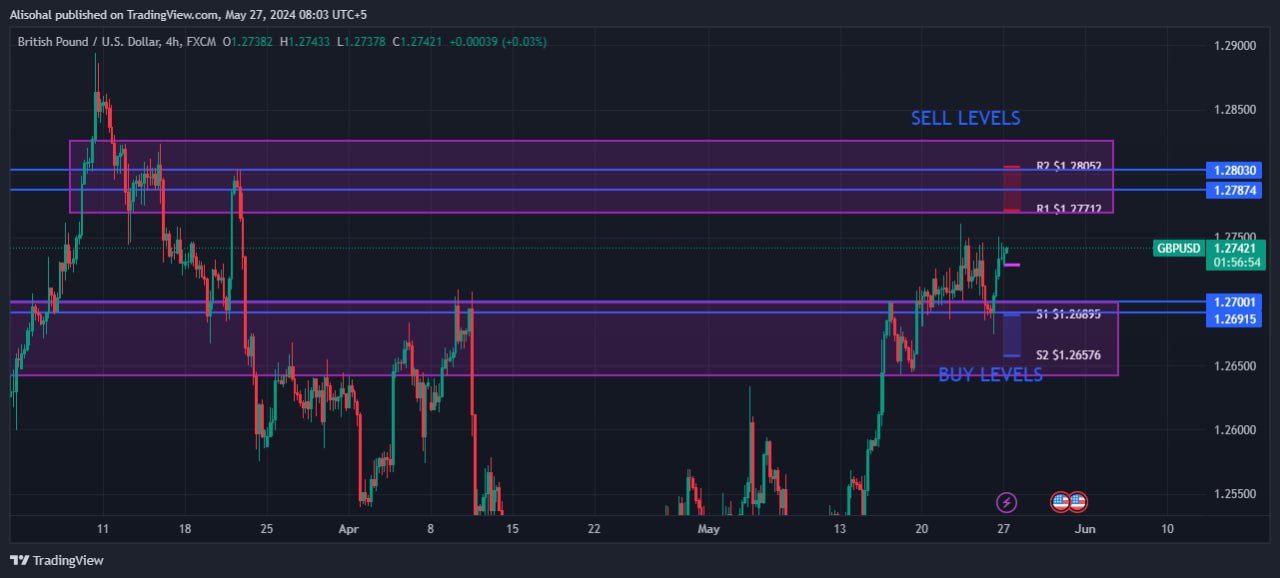
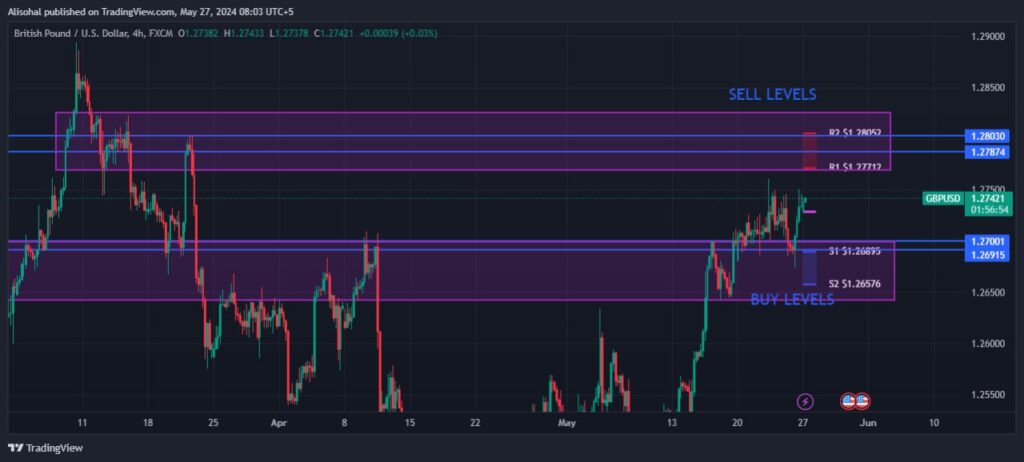
Let’s explore the intraday dynamics of the GBPUSD pair, focusing specifically on the H4 timeframe to provide traders with valuable insights into potential support and resistance levels, accompanied by key analysis:
🔍 H4 Support and Resistance Levels:
Support: In the H4 chart, immediate support is noted around 1.2700, followed by a stronger support zone near 1.26900.
Resistance: Resistance levels are observed near 1.27874, with additional hurdles likely at 1.2800 and 1.28200.
📊 Risk Management:
Effective risk management is crucial for intraday traders. Employing strategies like setting stop-loss orders and adhering to proper position sizing helps mitigate potential losses in volatile market conditions.
Monitoring economic calendars for scheduled data releases and central bank announcements is essential for anticipating market volatility and adjusting trading strategies accordingly.
🚨 Caution: Intraday trading involves inherent risks due to rapid price movements. Traders should exercise caution and remain vigilant, especially during periods of heightened volatility or unexpected news events.
📈 Disclaimer:
The analysis presented here is for educational purposes only and should not be considered financial advice. Traders are encouraged to conduct their own research and seek professional guidance before making any trading decisions.
Stay tuned for real-time updates and further analysis as the GBPUSD pair unfolds on the H4 timeframe. Happy trading! 💱📈

